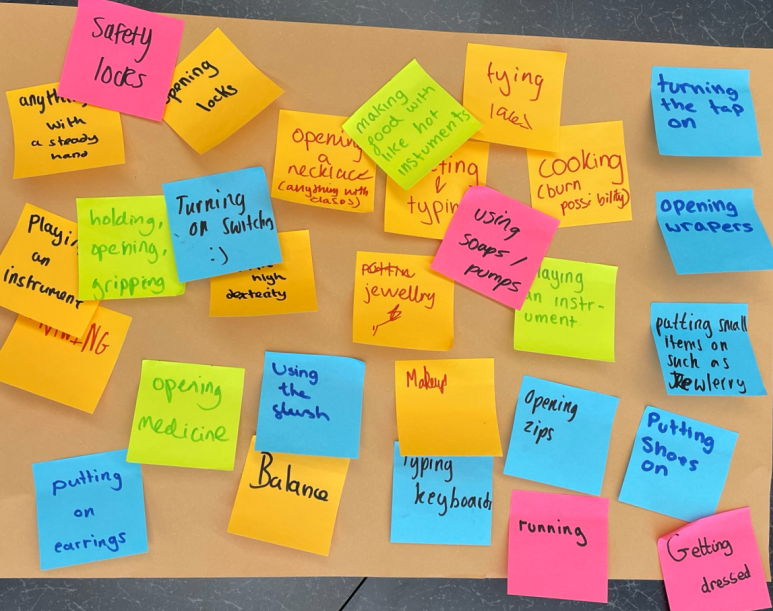
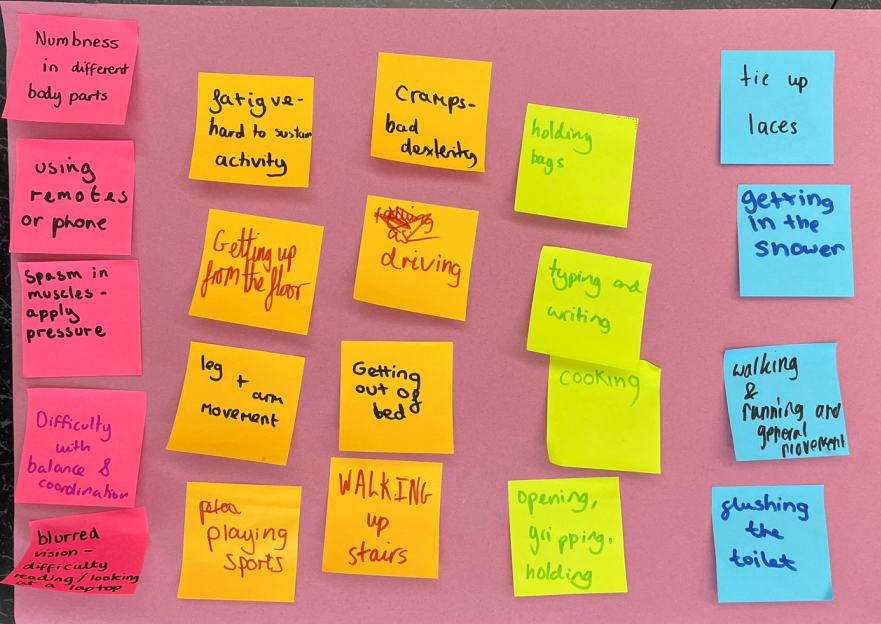
This week, we have a post-it note activity that is all about collaboration between students. Morven’s Year 9 DT students considered the impact of physical disability on individuals’ lives using post-it notes to share ideas. Using post-it notes is quick in terms of teacher preparation time, but can be really impactful. Plus, the physical (rather than digital) nature of this makes the most of being back in the classroom together.
This is how Morven’s post-it collaboration worked:
Students were on their feet in groups of 4.
On different tables there were disability fact files.
Each group had 2 mins to read the disability fact file on their table. They then had to jot down ideas on post-it notes of activities that their user might struggle with.
At the end of the allocated time, they then moved onto the next table and repeated the activity.
Each group had a different colour of post-it note.
After groups had rotated round all tables, Morven chose one student from each team to give a brief overview of their fact file. Then as a group they evaluated all the post-it notes from across the groups and chose the three post-it notes which jumped out at them to share back to the class
Morven took photos of the post-it notes and put them on Teams.
Next lesson they will begin to design potential solutions for these scenarios.
Benefits
Peer evaluation is built into the feedback process – students need to review other groups’ ideas and weigh them up.
The pace kept students focussed and on task.
The physical nature of the activity capitalises on being back in the physical classroom.
Students were thinking for themselves using stimulus information.
Neurodiversity considerations for this activity from Isabelle and Catherine
Be aware of sensory sensitivities:
Touch: Some students might find the close proximity of collaborating on the same sheet of paper difficult.
Noise: Some students might find the group talking section of this too loud.
Be aware that the time allocation may not suit students with different processing speeds, so ensure that thinking time is built in to make the pace manageable.
Please be aware that it is important to set boundaries for some students who might have hyper-activity tendencies.
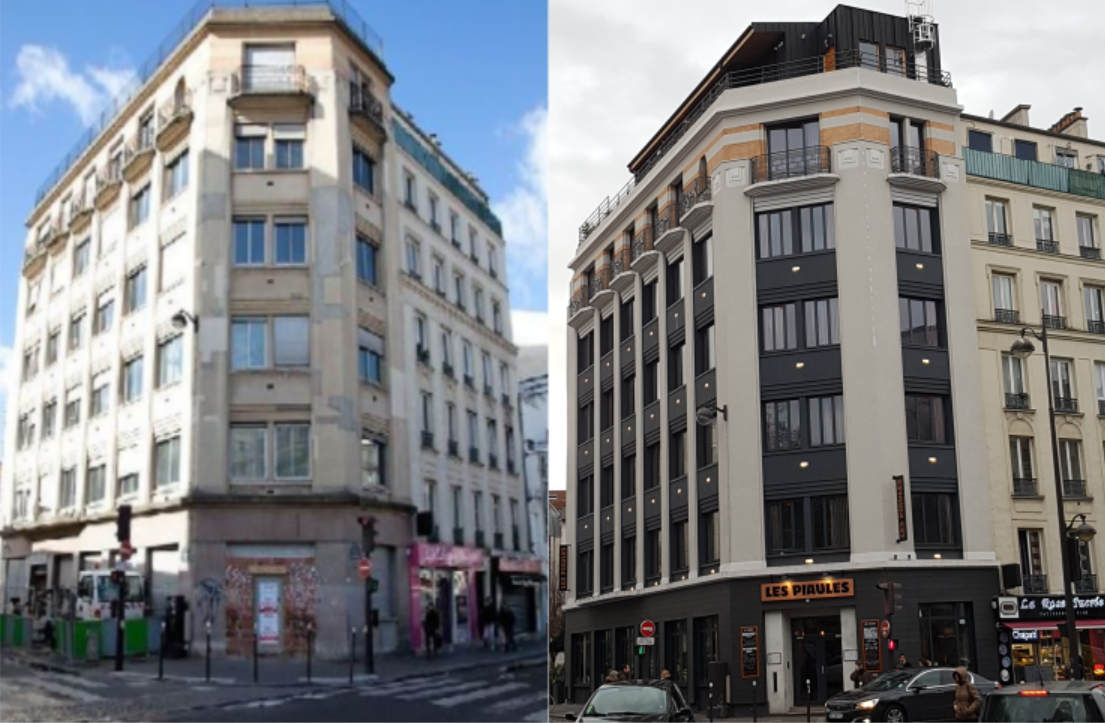
Amy (Year 13) looks at the issues surrounding gentrification of an area and the impact this has on the value and cultural capital of an area.
Gentrification has often been seen as a contested and negatively connoted process; it is routinely blamed to be destroying the ‘souls’ and ‘hearts’ of many cities across the globe, with higher housing costs to increasingly globalised high streets acting as forces driving those less privileged out of historically culturally rich community areas. It can be seen as an oppressive mechanism which, in potentially adding fiscal value to an area, does so at the expense of cultural diversity.[1]
Gentrification is a term first created more than 50 years ago by the German-born British sociologist Ruth Glass to describe changes she observed in north London – but it is a phenomenon that has been at the heart of how cities evolve for centuries. Cambridge dictionary defines the term as ‘the process by which a place, especially part of a city, changes from being a poor area to a richer one, where people from a higher social class live.’[2] It is an important factor in the change and transformation of urban areas. However, whether it really eradicates poverty is subject to lively debate.
From NewDream.org
In London especially, gentrification characterises economic and demographic changes as the predominantly middle-class citizens settle in areas often occupied by high percentages of ethnic minority residents, who are often priced out of the new ‘improved’ areas. Not only does it have significant negative impact on smaller community areas, it also sends ripples throughout the rest of the country and down the class hierarchy.
Much resistance has been seen from those who see the process as an antagonised way of removing character and community from an area. In particular, estate agents and property developers are subject to this disapproval, with many campaigners vocal against their activities, given they seek to make money from attracting new, richer residents. Especially extreme campaigns such as the 200 anti-gentrification and housing campaigners that disrupted the beginning of the annual Property Awards in 2016 reveal the strong opinions many people have towards the process of gentrification.
When examining this change in London, it is important to inspect the history and background of the city itself. Gentrification is not a new process to the city, beginning in the 1960s when bits of the run-down, old post-war city attracted adventurous young architects who started doing up often cheaper, damaged, Georgian squares. The process is deeply ironic, as these forces of change accused of ruining London are products of its revitalisation.
Decades ago London was still recovering from detrimental damage done during World War 2. The population of inner London was still attempting to recover to its pre-war importance. At this point, it wasn’t the wealthy being the cause of change in the area but skilled manual workers seeking cheap and convenient land, headed for ‘the New Towns’ in the 1950s.
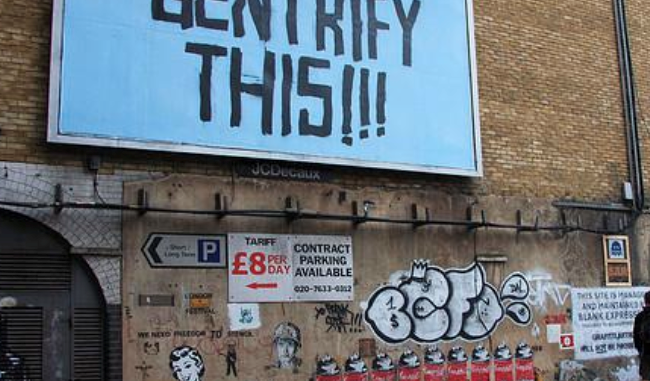
By the start of the 2000s however, London’s dynamic had completely changed. London had become an influential source of economic growth, catalysed by its ability to generate money from its ‘turbo-charged’ Square Mile. Increased profit immensely amplified the attractivity of London, in turn increasing the demand of space in the city. It is regularly said that ‘demand for space is the seed of gentrification’[3], and a failure to meet that demand is what stimulates the growth of it. London is a prime example of this. Hugely inflated property prices are a certain cost of gentrification, and this can be seen all throughout London. The average house price in Hackney, and area renowned for its influence of gentrification, has increased by 489% in the last two decades, up from £91,000 in 1998 to £536,000 in 2018. This directly drives out many ethnic minorities and those living on low income or relying on government benefits to afford housing costs.
Hackney wick’s ‘graffiti building’ – from Londonist.com
The standard picture of gentrification is that new arrivals benefit greatly from gentrification at the expense of lower-income residents. This picture is often true in many cases. New arrivals to a community often get stylish housing and all of the expensive accessories of life in a trendy urban neighbourhood (boutiques, bookstores, coffee shops, clubs and more) that they can afford. While long-time residents may benefit initially from cleaner, safer streets and better schools, they are eventually priced out of renting or buying. As the new arrivals impose their culture on the neighbourhood, lower-income residents become economically and socially marginalized. This can lead to resentment and community conflict that feeds racial and class tensions. Ultimately as lower-class members of the community move out this can induce loss of social and racial diversity. Rowland Atkinson, a member of the ERSC centre for research describes it as ‘a destructive and divisive process that has been aided by capital disinvestment to the detriment of poorer groups in cities.’[4]
However, should gentrification really be held accountable for the unacceptable level of poverty in London? Assertions that it is ‘pushing out’ the deprived of the city often look less persuasive when examining the figures of social housing which still exist in classic ‘gentrified’ areas of north London. In Camden, 35% of all housing is for social rent, in Islington it’s 42% and in Hackney, 44%. Although poverty rates have fallen in those boroughs, the absolute numbers of poor people (people living on the reliance of government benefits) remain high.
Although there are many deservingly negative outlooks on the consequences of gentrification, assumptions should not always be made to antagonise the process. For example, middle class pressure often leads to improvement in community features such as modernised and beautified public buildings and spaces. As the property tax base increases, so does funding to local public schools. Jobs arrive with the increased construction activity and new retail and service businesses, and crime rates habitually decline.
Edward Clarke of the UK urban policy research company Centre for Cities writes that the debate should not be reduced to ‘a simple battle between plucky communities and greedy gentrifies’, emphasising that this ‘fails to recognise that the roles and functions of urban neighbourhoods have always changed over time and within a city’ or to acknowledge that gentrifying ‘new work businesses can create new jobs and improve wages in many fields.[5]
Clarke concludes in general that the real roots of the problems that come with thriving urban economies are ultimately down to “poor city management”. He argues that to improve this it requires better skills training for local people, more planning and tax-raising powers to be devolved to local politicians and more land, including a small portion of green belt, being made available for building.
Ultimately gentrification, as a form of change and transformation in urban areas, is an issue that has been going on for decades. Although it potentially brings improvement to the appearance and functionality of urban environments, the problems created by this process must be addressed; failing to do so will result in places like London becoming so unaffordable they will begin to deteriorate – not only in potential economic value, but also in cultural capital. The process often exacerbates inequality on a local scale and drives out the cultural diversity that can so often be found at the heart of London’s communities.
Bibliography
Glass, R. (1964). London: Aspects of Change. London: MacGibbon & Kee
Hill, D. (2016). Let’s get our gentrification story straight. London: Guardian
Dr Atkinson, R. (2002). Does Gentrification help or harm urban neighbourhoods? An assessment of the evidence-base in the context of the new urban agenda. CNR Paper 5
Clarke, E. (2016). In defence of gentrification. London: Centre for Cities
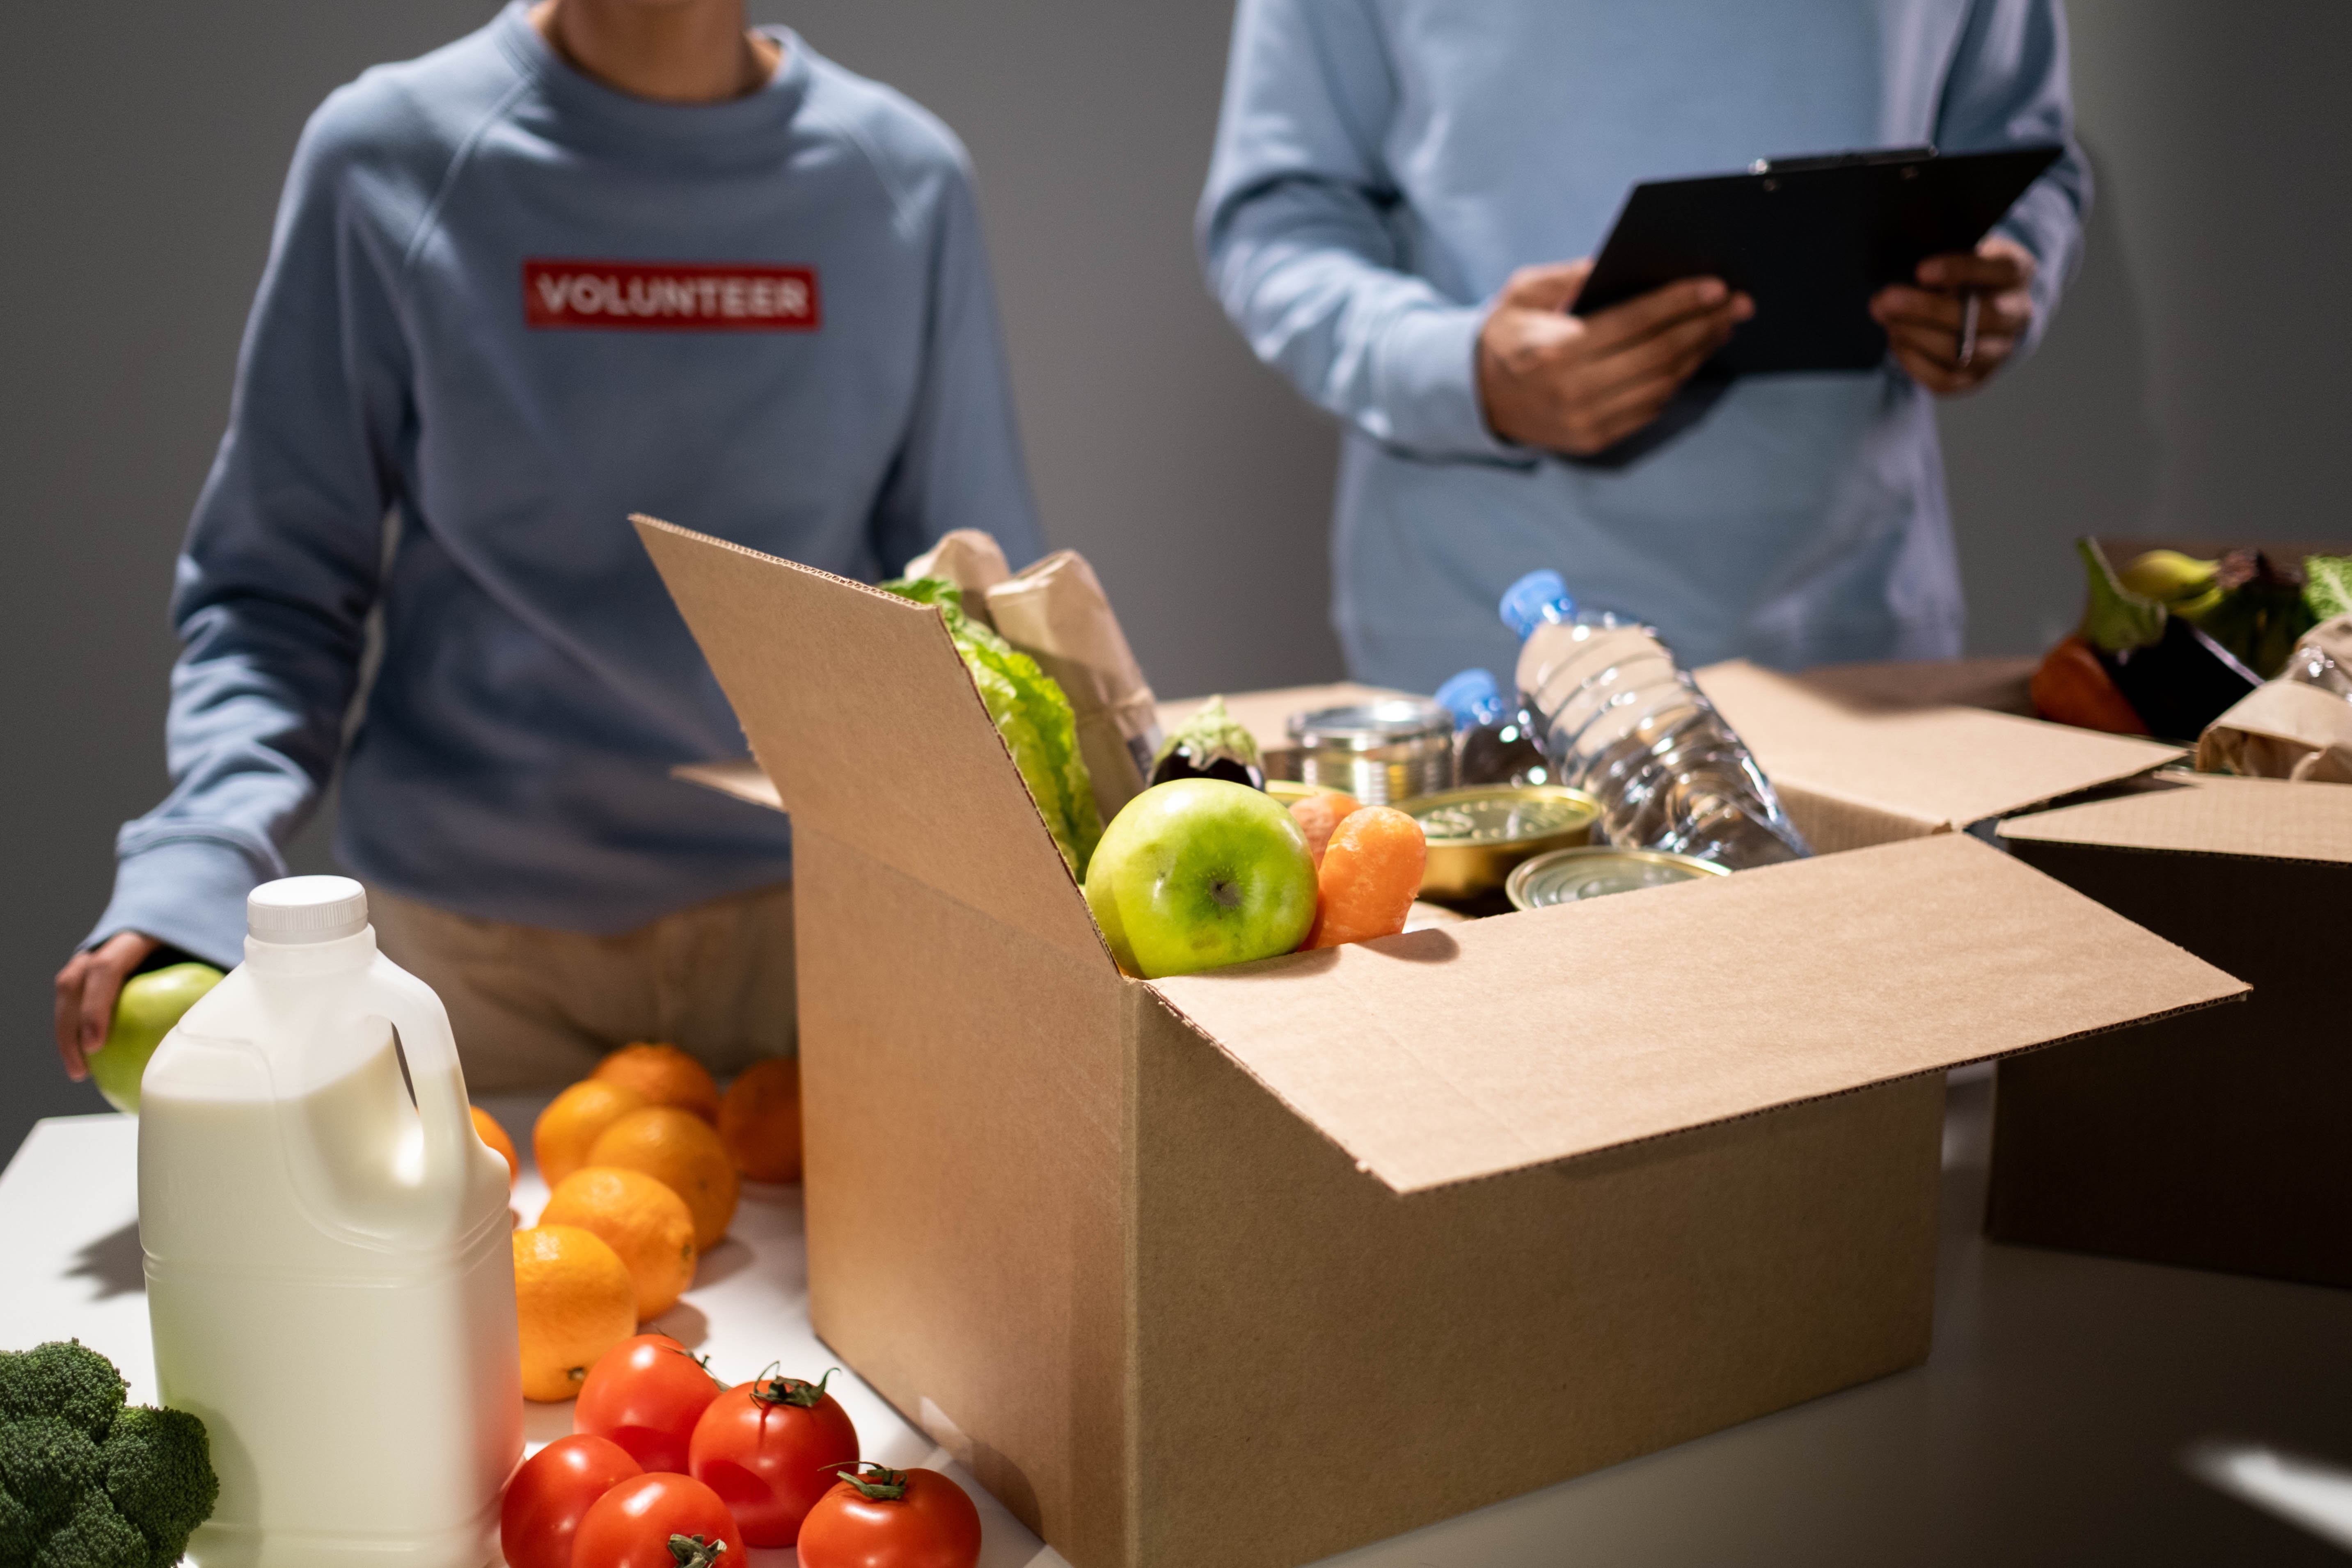
Alex in Year 13 writes a short introduction to foreign aid, highlighting some of the successes and problems that can appear from the charitable act of giving.
Instilled in us from a young age is the principal that we should help those who are in extreme need. And what could be simpler? From charity mufti days and bake sales, this theory underpins social behaviour in our modern day. It is indeed this principal that drives support for foreign aid.
In the words of Roger Riddell, ‘The belief that aid is a ‘good thing’ is sustained by the assumption that the resources or skills that aid provides do make a difference to those being assisted’. However, the impact of such aid on recipient countries is not always as positive as it may initially appear.
As the effects of climate change enhance the frequency and severity of natural disasters, we often see foreign aid expenditure in an emergency form. Altruism of this kind is uncontested as in the short-term these humanitarian responses are overwhelmingly positive. However, it is with sustained aid that potential problems arise.
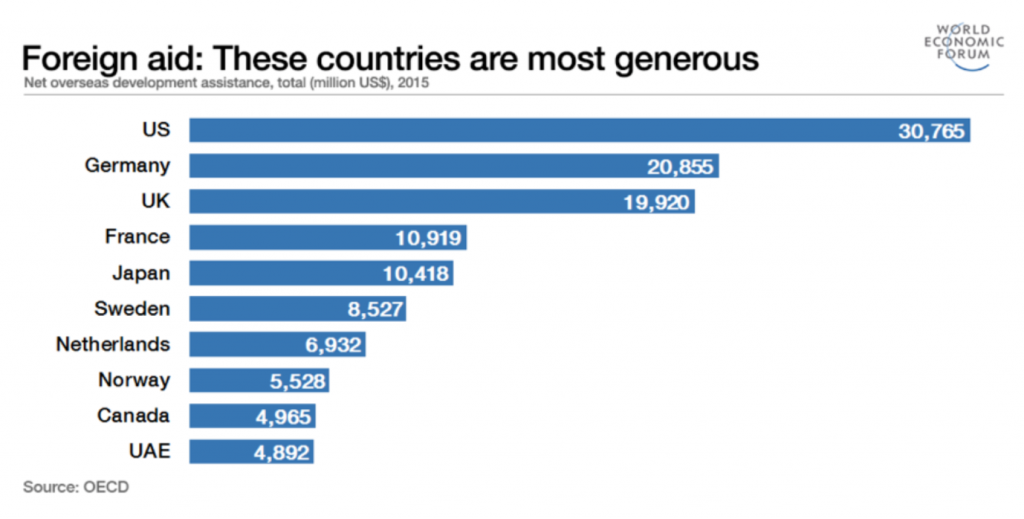
Overtime, foreign aid has expanded from small beginnings to become a large and complex global enterprise. Development cooperation (as foreign aid is also called) is now established as an integral part of international relations, with many donor countries contributing at a UN target rate of 0.7% of their gross national income. For the UK, this sum stood at £14.6 billion in 2018. As can be seen from the charts below, few countries meet this target.
Net development assistance by country (total million US$ in 2015)
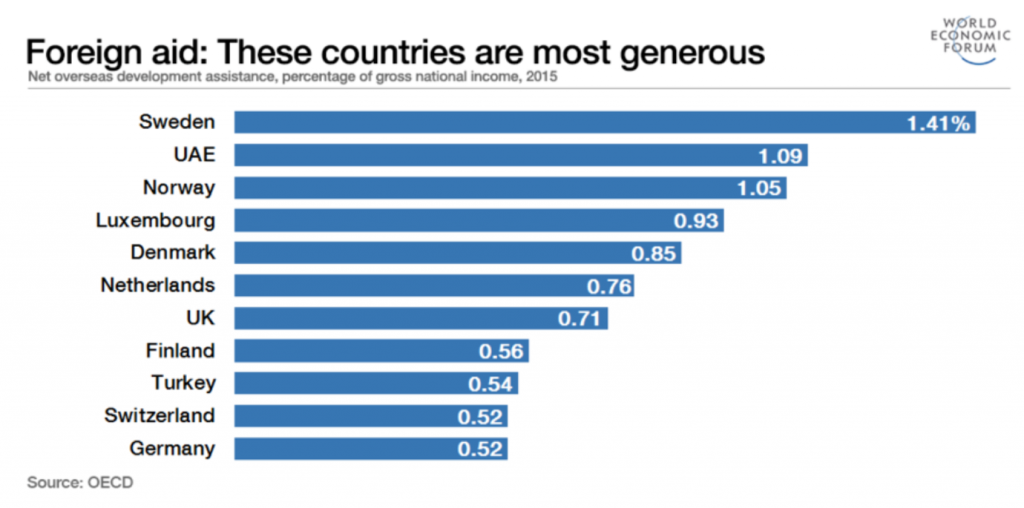
However, if we compare this data above with looking at this giving as a percentage of GDP, a rather different picture emerges:
For many people, this huge economic contribution to foreign aid and development is a triumph in the world of humanitarianism and society as a whole. An ethical theory linked closely with the topic of foreign aid is utilitarianism. To put it simply, this is the notion that ‘moral life should be guided by the objective of trying to achieve the maximum happiness for the greatest number of people.’
As stated by Paul Streeten, ‘a dollar redistributed from a rich man to a poor man detracts less utility than it adds, and therefore increasing the sum total of utility’. This argument is comprehensive and easy to wrap your head around, which explains why foreign aid is so often short sightedly seen as a win-win situation.
Unfortunately, this is not always the case. There has been evidence of several key factors that can inhibit the aggregate impact of foreign aid.
The first problem arising with aid is its potential for misuse. Additional resources in the hands of potentially corrupt governments are significant impediments to optimum utilization of funds. This is because the fungibility of aid could enable the financing of non-developmental projects against the interest of the population. Hence, aid itself has, in some cases, the perverse ability to create negative effects on recipient economies.
Secondly, there are limits associated with aid and a country’s absorptive capacity. As the volume of aid increases, it is subject to diminishing marginal utility. In basic terms, the effect is as if I gave you one chocolate bar that you enjoyed consuming. And perhaps a couple more wouldn’t do you any harm… but once I’ve given you 100 chocolate bars, each individual bar’s worth has decreased along the way. In this way it can be seen than after a certain point (called the absorptive capacity threshold), providing more aid becomes completely ineffective.
Finally, fluctuations in aid inflows are external shocks to vulnerable economies, which plan expenditures based on promised aid commitments. When a highly dependent country’s aid is not given in full, this can damage future growth prospects significantly.
From all this, we can gather that the future of aid-giving and its associated policies may need modifying to ensure aid is given and used in the most efficient and appropriate ways possible, enabling it to help those who are most in need.
Europe is rich in languages – there are over 200 European languages and many more spoken by citizens whose family origin is from other continents. This is an important resource to be recognised, used and cherished. Learning other peoples’ languages is a way of helping us to understand each other better and overcome our cultural differences. So with Brexit fast approaching, what better time to remember that even if we are no longer members of the European Union, the UK is still in Europe.
The Languages Departments celebrated languages through an exciting photo competition in which students were challenged to capture what Europe means to them. Is it a sense of community, a feeling of belonging, diversity, language learning, opportunity, future study or work, family, holidays or something else entirely? Click on the link below to peruse the prize winning entries.
Having learnt about the role various political parties play in terms of immigration politics, Marina (Year 13) has written a comparison between the current Alternative für Deutschland party and the former Nationalsozialistische Deutsche Arbeiterpartei.
Wir wissen alle von der NSDAP (Nationalsozialistische Deutsche Arbeiterpartei oder die Nazis) aber heutzutage gibt es die AfD (Alternative für Deutschland) – sie ist nicht so bekannt. Dieser Vergleich von Parteien ist ganz interessant, weil diese unbekanntere Partei vielleicht genauso gefährlich sein könnte. Erfreulicherweise hat die AfD nicht so viel Macht in der Bundesregierung, aber wenn sie mehr hätte, würden viele Leute und die Demokratie wahrscheinlich in Gefahr schweben. Falls du nicht so viel über die AfD weiss, habe ich hier eine kleine Zusammenfassung zu der Partei geschrieben, aber ich würde dir gerne empfehlen, dass du die beiden Parteien recherchierst. Es ist immer gut, neugierig über andere Länder zu sein.
Alternative für Deutschland
Die Leiter: Jörg Meuthen und Tino Chrupall
Wann gegründet: 2013
Ihre Politik:
Gegen Merkels Einwanderungspolitik
Will Deutschland aus der EU ziehen
Will den Euro zugunsten der Deutschen Mark aufgeben
Will Asylgesetze verändern, das heißt sie will keine Flüchtlingsquote und sie unterstützt die Rückführung von Einwanderen
Andere:
Derzeit sind die AfD die größten Gegner für den Bundestag
Einer der früheren Führer, Bernd Lucke, sagte, dass die Partei nach dem Austritt aus der Partei im Jahr 2018 immer fremdenfeindlicher wurde
Ähnlichkeiten mit der NSDAP
Man kann einfach die Ziele der Parteien vergleichen?
Sie möchten beide, dass es nichts ‚Nichtdeutsches‘ gibt. Für die NSDAP bedeutet das, dass es keine linksorientierte Literatur und die ‚Ideale Rasse‘ gibt und für die AfD, dass sie gegen die Entscheidung Merkels kämpfen, 1,3 Millionen Migranten aufzunehmen
Die Parteien hatten beide turbulente Wege
Im November 1932 hat die NSDAP 11% weniger Wählerstimmen bekommen, als sie nur 4 Monate früher bekommen hatte.
Im Gegensatz dazu, ist es schwer für die AfD eine Regierungsmehrheit zu kriegen, weil die CDU und CSU ein großes Teil der Regierungssitze haben.
Unterschiede zwischen den Parteien
Die Eine war öffentlich schwulenfeindlich und rassistisch, und die Andere versucht, ihre Ideen nicht ganz so deutlich zu zeigen.
Allein die Existenz der Konzentrationslager hat bewiesen, dass die NSDAP öffentlich schwulenfeindlich und rassistisch war.
Die AfD ist vermutlich auch schwulenfeindlich (und fremdenfeindlich), aber sie möchte es nicht zeigen und sie gesteht es nicht ein.
Zum Beispiel benutzt eine Hauptfigur der AfD die Tatsache, dass sie mit einer Frau zusammen wohnt, um zu zeigen, dass die Partei nicht schwulenfeindlich ist.
Auf der anderen Seite haben viele andere Figuren der Partei rassistische Aussagen gemacht.
Die NSDAP hat sich auf Wähler aller Gesellschaftsschichten konzentriert, wohingegen die Unterstützer der AfD sich manchmal sowohl in der Mitte-links als auch im Rechtsaußen-Spektrum befinden.
Erwerbsarme haben die NSDAP unverhältnismäßig unterstützt.
Es gibt kein typisches Profil für die Unterstützer der AfD. Sie sind Bürger in jedem Alter und von jedem Bildungsniveau, die einzige Ähnlichkeit ist, dass sie gegen Masseneinwanderung sind.
Also?
Es steht fest, dass die Hauptideologien dieser Parteien sich unglaublich ähnlich sind. Außerdem muss erwähnt werden, dass Unterschiede zwischen den Parteien wahrscheinlich nur wegen der abweichenden Gesellschaftsnormen verursacht werden. Jedoch, meiner Meinung nach, ist die AfD nicht annährend so gefährlich, oder zumindest nicht in diesem Moment. Leider lässt sich nicht leugnen, dass sie immer noch dem Leben von vielen Leuten in Deutschland schaden kann.
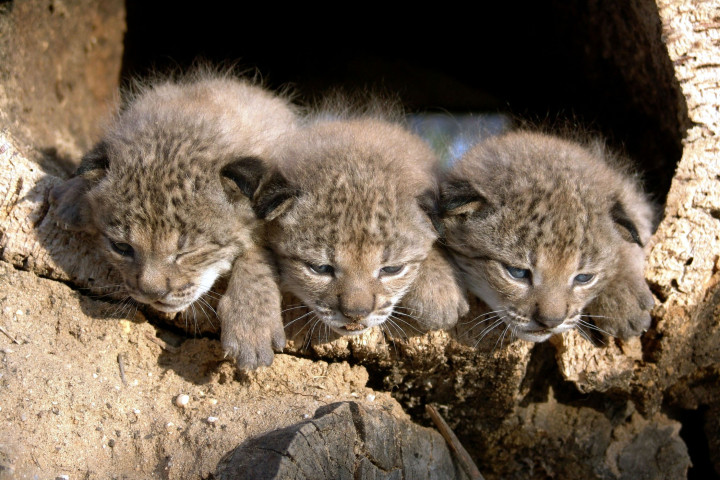
Spain has the second highest number of mammals in Europe, with 115 discovered species. Spain is also home to the most endangered species of cat in the world, the Iberian Lynx. Matilda (Year 12) explains everything about this fascinating animal and the reasons for its endangerment.
La especie de gato en mayor peligro de extinción del mundo
El lince ibérico, que se encuentra en España, es la especie de gato en mayor peligro de extinción del mundo. En 2014 quedaban menos de 100 linces ibéricos adultos en España, pero ahora ha aumentado a 500 gracias a los programas de conservación y las leyes para protegerlos.
¿Dónde están? -La distribución y el hábitat
El lince ibérico estuvo una vez presente en toda la Península Ibérica y el sur de Francia. Las poblaciones disminuyeron de 15 subpoblaciones en la década de 1940 a solo dos subpoblaciones a principios de la década de 1990, más notablemente en Montes de Toledo y Sierra Morena. Entre las décadas de 1960 y 2000, ha perdido alrededor del 80% de su rango anterior. El lince ibérico prefiere ambientes de pastizales abiertos mezclados con densos arbustos, sin embargo, ahora está restringido a áreas montañosas, lo que es una de las razones del declive de la población.
¿Por qué están en peligro?
Los Humanos
Su peligro se debió a la caza excesiva, los choques de automóviles y la fragmentación de sus hábitats. Se les cazaba por su valiosa piel y carne. En 2014, 22 linces ibéricos murieron atropellados por coches, un número muy elevado teniendo en cuenta el tamaño de la población. La fragmentación de sus hábitats se debe a que los humanos construyen infraestructuras a través de sus hábitats, lo que crea una barrera entre las poblaciones que, finalmente, mueren.
La Comida
La población de su principal alimento, el conejo europeo, ha disminuido debido a una enfermedad llamada mixomatosis. Aunque si un conejo europeo está vivo con mixomatosis, el lince aún puede comerlo y no enfermarse. Esto es importante para el ecosistema, ya que actúan como control de enfermedades para que otros conejos y especies de la zona no contraigan esta enfermedad.
La infertilidad
La dificultad para encontrar pareja ha provocado una mayor endogamia, lo que se traduce en menos cachorros y una mayor tasa de infertilidad en los machos, por lo que hay una disminución de la población.
¿Cuál es un dato interesante sobre el lince ibérico?
Los hermanos se vuelven violentos entre ellos entre 30 y 60 días. Un cachorro mata con frecuencia a su hermano en una pelea brutal. Se desconoce por qué ocurre esta agresión entre los hermanos gatitos, aunque muchos científicos creen que está relacionada con un cambio en las hormonas cuando un gatito cambia de la leche materna a la carne. Otros creen que está relacionado con la jerarquía y la “supervivencia del más apto”.
Did you know? French is the official language in 29 countries, which puts it in second place behind English. Half of all French native speakers live in Africa. Year 9 have been researching other countries where French is spoken as part of their exploration of the Francophonie. This year also marks the 50 year celebration of the foundation of the international organisation of francophone countries.
Le lac rose au Sénégal
Le Sénégal
Le Sénégal est un pays dans l’ouest de l’Afrique. Il y a des paysages vraiment jolis et magnifiques. La capitale de Sénégal est Dakar et à Dakar il y a beaucoup de personnes. Dakar est sur la côte ouest de Sénégal. L’animal national est un lion mais le lion est presque disparu. Au Sénégal, on peut visiter beaucoup de monuments célèbres et il y a tant d’activités à faire, tel qu’un safari ou visiter un parc national. Il y a un lac rose, qui est une chose incroyable et spéciale. Un monument bien connu est le monument de la renaissance africaine. Aussi, il y a une île faite de coquillages. Aussi, on peut manger dans beaucoup de restaurants et la nourriture est délicieuse. Au Sénégal, il fait très chaud tout au long de l’année. Dans le nord, il pleut en juillet, août et septembre mais dans le sud, il pleut en juin, juillet, août, septembre et octobre.
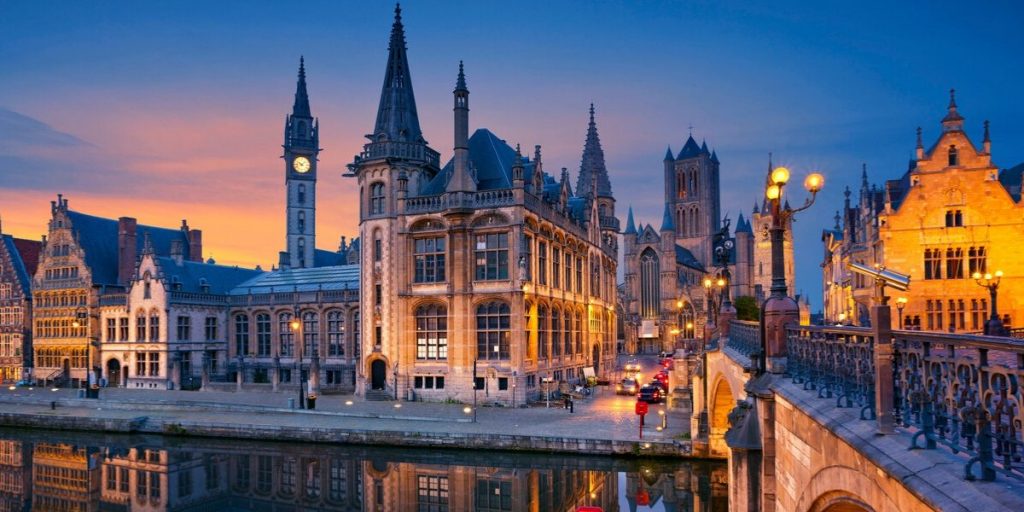
Bruxelles
La Belgique
Bonjour, j’habite à Bruxelles qui est la capitale de la Belgique. J’adore Bruxelles parce qu’il y a beaucoup de choses à faire. On peut y visiter la Cathédrale de saint-Michel et Saint-Gudula, manger des gaufres délicieuses et du chocolat et il y a une grande place au centre-ville. Cependant, on ne peut pas faire des activités au bord de la mer parce que Bruxelles est au centre de la Belgique. A Bruxelles, il y a de belle architecture partout par exemple, Manneken Pis et la gare Centrale de Bruxelles. Il y a aussi beaucoup de musées dans la ville où on peut voir des objets historiques.
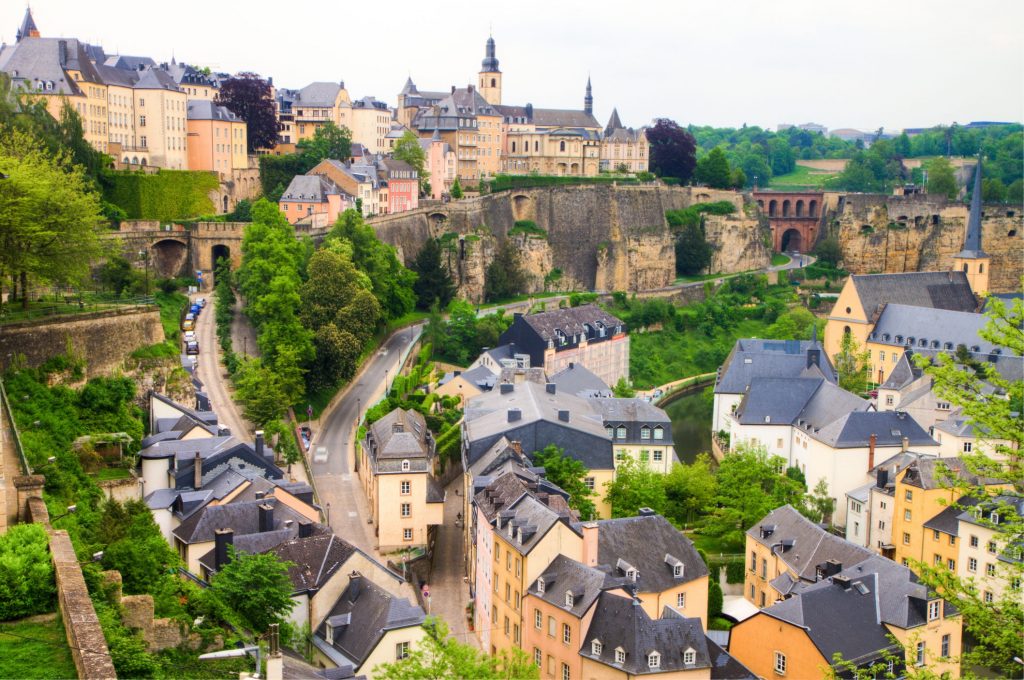
Le Luxembourg
Le Luxembourg
La capitale de Luxembourg s’appelle Luxembourg-Ville aussi. Elle est située dans le centre du pays. Il y a beaucoup de collines est la ville est assez historique. J’habite au centre-ville, dans une petite maison. Je n’habite pas près de la mer parce que le Luxembourg est un pays enclavé. La météo au Luxembourg est affreuse, il n’y a pas beaucoup de soleil, comme en Espagne. Normalement, il fait un peu froid et il pleut. Il fait le plus chaud en juin, il fait 23 degrés. Mais en janvier il peut faire -2 degrés. La majorité de la pluie est en décembre, normalement il y a 83,3mm. Parfois, il y a aussi de la neige en décembre, mais, ce n’est pas normal. Mais, il y a plein de choses à faire, on peut visiter des attractions touristiques, comme le pont du Grand Duchesse Charlotte, qui est un grand pont rose. Aussi on peut visiter le Plateau Bourbon qui est magnifique. Pour les sports il y a tellement de choses à faire comme le cyclisme, le golf, le tennis, le criquet et la patinoire. Aussi il y a le Tour de Luxembourg qui a lieu après le Tour de France, le cycliste célèbre Andy Schleck participe au tour.
Les Seychelles
Les Seychelles
Les Seychelles sont situées dans l’hémisphère sud et au nord-est du Madagascar. Aux Seychelles il y a cent quinze îles. Victoria est la capitale des Seychelles. C’est dans le nord-est de l’île de Mahé. Dans la République des Seychelles, normalement, il fait beau. Il y a un climat tropical. Les mois chauds sont de juin à mars, et, la saison des pluies est de novembre à mars. En hiver, il ne neige pas et il ne fait pas très froid. Si on va aux Seychelles, on peut aller nager ou on peut se détendre sur la plage. Si on est fatigué, on peut aller à la pêche ou on peut louer un bateau ! C’est célèbre pour tant de plages magnifiques, et j’adore aller nager avec les tortues et faire des promenades et des guides touristiques ou faire du cheval. J’adore les Seychelles parce que c’est un beau pays. J’aime y faire de la natation car normalement, il fait chaud. La chaleur est insupportable ! Une personne célèbre qui est née aux Seychelles, c’est Diana. C. Zollicofer. Elle est actrice.
Talia and Hannah (Year 9) tell us about their daily lives during the time of coronavirus. Their lives are still surprisingly normal!
Talias Tagesablauf
Ich stehe um 6 Uhr auf. Ich wasche mich und ich ziehe mich an. Um 7 Uhr frühstücke ich. Ich esse gern Frühstücksflocken oder Joghurt weil sie lecker sind. Ich will heiße Schokolade trinken aber ich darf nicht.
Ich gehe mit dem Bus oder zu Fuß zur Schule. Ich wohne nicht weit weg. In der Schule lerne ich Mathematik, Kunst, Biologie, Chemie, Physik, Musik, Französisch und mehr. Ich mag English weil es interessant ist. Mein Bruder steht um halb acht Uhr auf. Er hat Haferbrei zum Frühstück und geht mit dem Auto zur Schule. Er lernt nur Mathe, Englisch, Philosophie und Volkswirtschaftslehre weil er das Abitur macht. Meine Mutter steht früh auf. Sie arbeitet von zu Hause. Sie arbeitet im Fernsehbereich.
Ich komme um 4 Uhr nach Hause. Am Montag habe ich Theater, wir machen ‘The Merchant of Venice’. Es ist lustig. Ich habe Chor am Donnerstag und Ensemble am Mittwoch. Im Zweiwochenrhythmus habe ich schwimmen am Freitag. Ich will es mehr haben aber wir dürfen nicht wegen Covid-19. Am Wochenende mache ich Hausaufgaben. Mein Bruder rudert am Wochenende. Er rudert auch zwölfmal pro Woche. Ich mag schwimmen mehr als rudern aber ich bin nicht sportlich. Letztes Wochenende bin ich mit meinen Freunden in den Park gegangen. Das Wetter war schrecklich. Es regnete die ganze Zeit und es war sehr kalt. Ich bin schnell nach Hause gegangen und ich habe Brownies gemacht. Sie waren lecker!
Hannahs Tage…
Ich wache jeden Schulmorgen um 6.30 Uhr auf. Ich wasche mich, ziehe mich an, dann frühstücke ich. Ich möchte gebackene Bohnen und Orangensaft zum Frühstück haben. Ich finde das sehr lecker. Dann putze ich mir die Zähne, packe meine Tasche und verlasse das Haus um 7.50 Uhr. Ich gehe zum Bahnhof und nehme den Zug von Clapham nach Wimbledon. Ich komme um 8.20 Uhr in die Schule an und warte bis 8.40 Uhr auf die Versammlung. Der Unterricht beginnt um 9.00 Uhr. Die Pause ist um 10.25 Uhr, ich esse etwas Obst, weil das gesund ist, und habe dann um 10.45 Uhr wieder Unterricht. Bis zum Mittagessen um 12.55 Uhr habe ich noch drei weitere Stunden. Ich esse mein Mittagessen in der Schule um 1.30 Uhr. Der Unterricht beginnt wieder um 2.15 Uhr. Um 4.00 Uhr fahre ich mit meinen Freunden mit dem Zug nach Hause und nehme den Bus vom Bahnhof zu mir nach Hause.
Auf meinem Weg zur Schule höre ich gerne Musik, sonst ist die Reise zu langweilig. Wenn ich nach Hause komme, ist es 4.20 oder 4.30 Uhr. Donnerstags habe ich Feldhockey in der Schule, wenn der Unterricht zu Ende ist, und danach Klubhockey. Mein Lieblingssport ist Hockey. Dienstags habe ich Astrophysik und Kosmologie-Klub auf einer Videokonferenz. Danach würde ich meine Hausaufgaben machen, mit meinen Freunden skypen, zu Abend essen und manchmal Videospiele spielen. An Wochentagen darf ich nicht fernsehen, so wie es auch sein soll.
Am Wochenende habe ich manchmal am Samstag Schulhockey, aber sonntags habe ich immer Klubhockey, was in der Regel ein Match ist. Ich wache spät oder früh auf, und zum Frühstück bekomme ich oft gebackene Bohnen oder Pfannkuchen mit Milch. Ich mache den Rest meiner Hausaufgaben und spiele dann Videospiele und sehe mit meiner Familie fern. Wenn meine Freunde frei sind, gehe ich mit ihnen und meinem Hund Tilly im Wimbledon Common spazieren oder gehe zu ihren Häusern. Normalerweise gehe ich nicht mit meinen Freunden einkaufen, aber mit meiner Mutter.
Meine Mutter wacht jeden Tag etwas später auf als ich, gegen 7.00 Uhr. Sie putzt das Haus, macht das Abendessen und geht mit dem Hund spazieren, wenn mein Vater arbeitet. Spät in der Nacht hört sie sich südkoreanische Podcasts, Nachrichten und Statistiken an, weil sie als Übersetzerin arbeitet und aus Korea kommt. Mein Vater wacht auch um 7.00 Uhr auf und macht mir Frühstück. Er arbeitet den ganzen Tag in seinem Büro an Geschäftsgesprächen und Online-Meetings. Freitags bleibt er manchmal mit seinen Freunden im Pub in Wimbledon oder geht zu jemandem nach Hause zu einer Party. An den Wochenenden kocht er hauptsächlich, weil er mehr Zeit hat. Meine Eltern gehen an Arbeitstagen von 9.00 bis 22.00 Uhr zur gleichen Zeit ins Bett wie ich. An den Wochenenden geht meine Mutter gerne früh ins Bett, und mein Vater geht wie ich gerne spät ins Bett und schaut fern.
Lauren, Year 13, discusses whether the Second World War influenced the 2016 Brexit vote.
Above: via http://theconversation.com/what-happens-if-parliament-rejects-a-brexit-deal-103939
Both World Wars had a dramatic influence on European relations in the first half of the 20th century, with the continent being divided during both conflicts. This made the formation of the European Economic Community (EEC) in 1957 extremely significant, as one of the reasons for its founding was to maintain peaceful relations between the countries of Europe.
There is a misconception which is prevalent among some people that Britain was alone during the Second World War after the French surrender. This is not entirely accurate. Britain was the largest imperial power in the world at the time, with either direct or indirect control over around 25% of the world’s population and almost a third of its land mass. Two and a half million soldiers from India alone served during the war, and lots of people from occupied countries also fought alongside the Allies, thus, demonstrating that the British were not isolated.
Furthermore, Britain did not have the same experience as most other countries during the war. This was largely due to the fact that it was never invaded because the Channel separated Britain from the rest of the continent, making it more difficult for its enemies to transport troops and resources over. This ‘island mentality’ has been maintained by some.
Above: Line of Soldiers via Pixabay
However, research conducted using Eurobarometer survey data shows that the war generation actually has a predominantly positive opinion of the EU, compared with the more negative views perpetuated by the immediately post-war generation. This is interesting because over-65s are always grouped together as one, but they actually often have very differing opinions.
On the 75th anniversary of D-Day, 122 veterans signed a letter calling for a People’s Vote on Brexit because they recognised that the EU has maintained peace in Europe and didn’t want to see a repeat of the war. They also challenged the Leave campaign’s mentions of the war as a reason for Brexit, pointing out that Churchill called for the creation of a “European family” to prevent another conflict.
It is worrying that so many politicians mentioned the Second World War in their arguments for Brexit and against the EU. For example, in May 2016 Boris Johnson argued that the EU was trying to create a European super-state like Hitler had created in the 1930s.
Another Conservative MP called the EU “ungrateful” in February and complained that Britain had received no money from the Marshall Plan of 1948, when in reality it received around 20% of the $12 billion dollars given to Europe, which was more than any other country.
The Second World War itself should not have contributed to the Brexit vote because the EEC, and later the EU, was partly designed to prevent another war, but myths and misconceptions surrounding the Allied victory fuelled the idea that Britain could “stand alone”, which is an argument often used by supporters of Brexit.
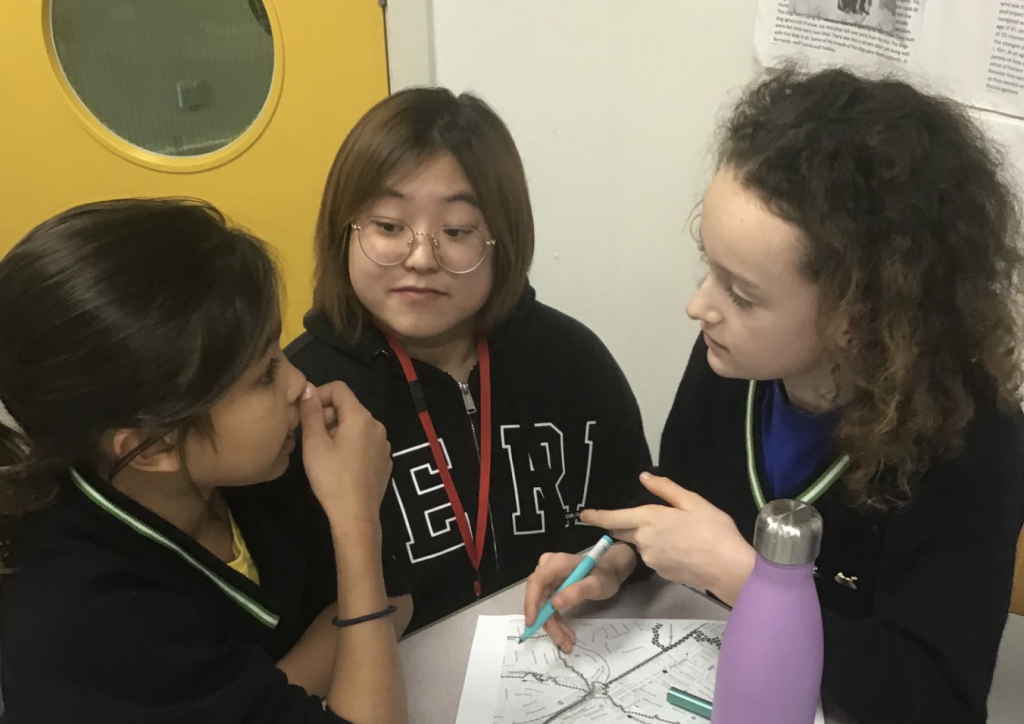
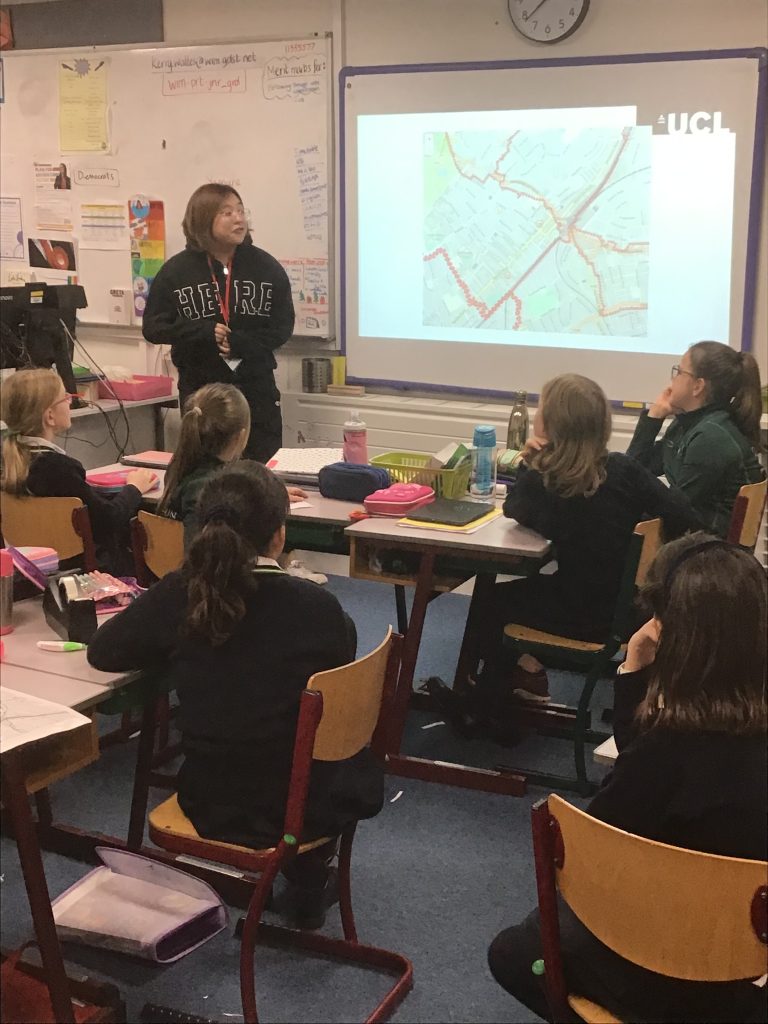
In October both of our year 5 classes were visited by teams of chemistry undergraduates from UCL as part of #UCLChemAirPoll. This amazing opportunity is part of a project involving year 5 and 6 children from across London, giving them an opportunity to work alongside chemistry students to find out more about air pollution local to our schools, and is led by UCL’s Professor Andrea Sella. Levels of the pollutant nitrogen dioxide are determined by the use of diffusion tubes, with the year 5 pupils acting as the local traffic experts deciding where the tubes should be placed, and the undergraduate students analysing the results back in their labs.
The diffusion tubes were in place for a month, and while the year 5 pupils were waiting for the analysis to be completed and the UCL students to return to tell us about the findings, we decided to carry out some additional investigations of our own…
Our year 5 pupils were very excited about being involved in this project and very much enjoyed working with the UCL chemists to find out more about air pollution, making predictions and deciding where the diffusion tubes should be placed. They asked if we could carry out some additional research so that we could share some of our own results with the UCL students on their return visit. We would then have our own results, the #UCLChemAirPoll results and secondary source data to present a detailed picture of the air quality in Wimbledon.
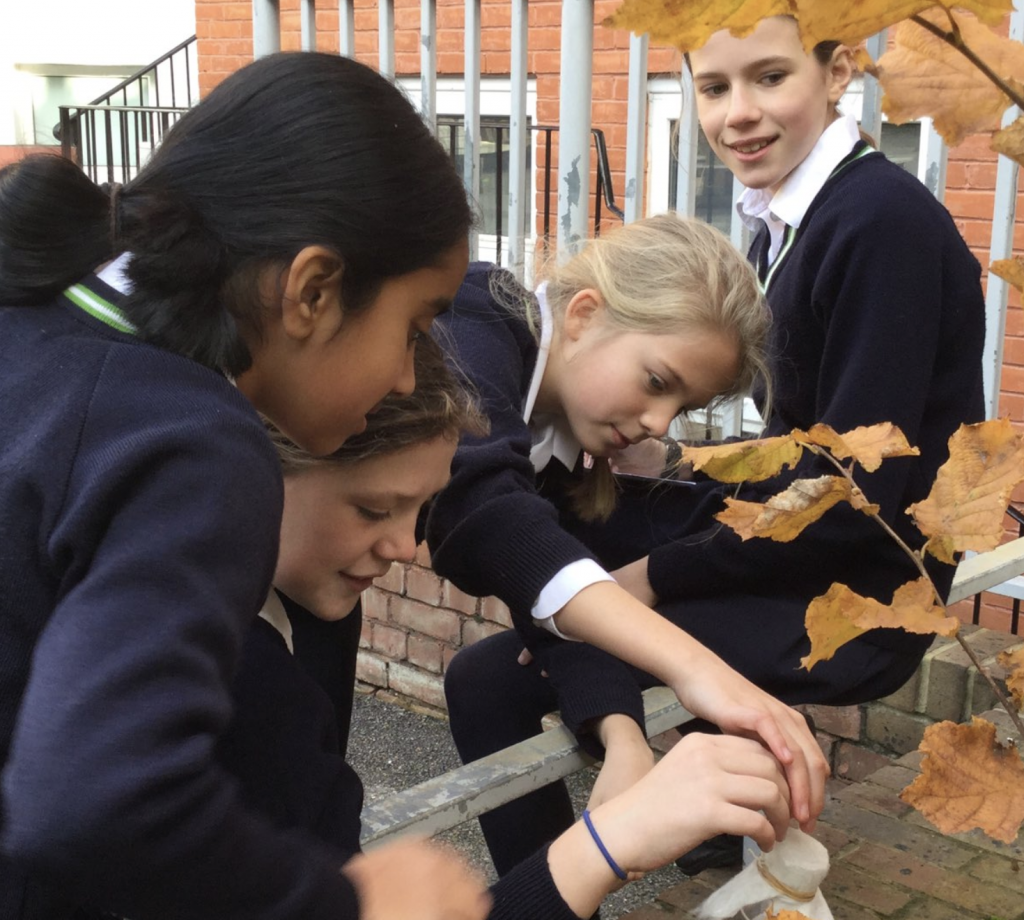
As part of our research we used data from the Breathe London website, information from the London Air website and also findings from the KCL Wearables Air Quality study. We were also lucky enough to hear a presentation from Emily, one of Wimbledon High’s year 13 geography A level students, who had completed her geography coursework project about the air quality in Putney High Street. Over October half term we also asked junior school families to look out for “tar spots” (actually a fungus) on Sycamore leaves and let us know how many they found, and where, so we could analyse the data as “tar spots’ are an indication of air quality.
Year 5, assisted by the year 6 STEAM Ambassadors, also constructed and set up some particulate catchers around the school site to find out if more particulates were detected closer to the roads, in quieter parts of the school, or near the building site.
Taking part in these series of lessons enabled the pupils to
be involved in a scientific investigation where the answer wasn’t already known
look at the difference between primary and secondary sources
make decisions about how to collect and record evidence
look for patterns and relationships in primary and secondary data
communicate with others using scientific language
We would like to say a huge thank you to Professor Sella and his team, and especially the students that came to visit us at Wimbledon High. They were amazing and our year 5 pupils were very much inspired by working with them.
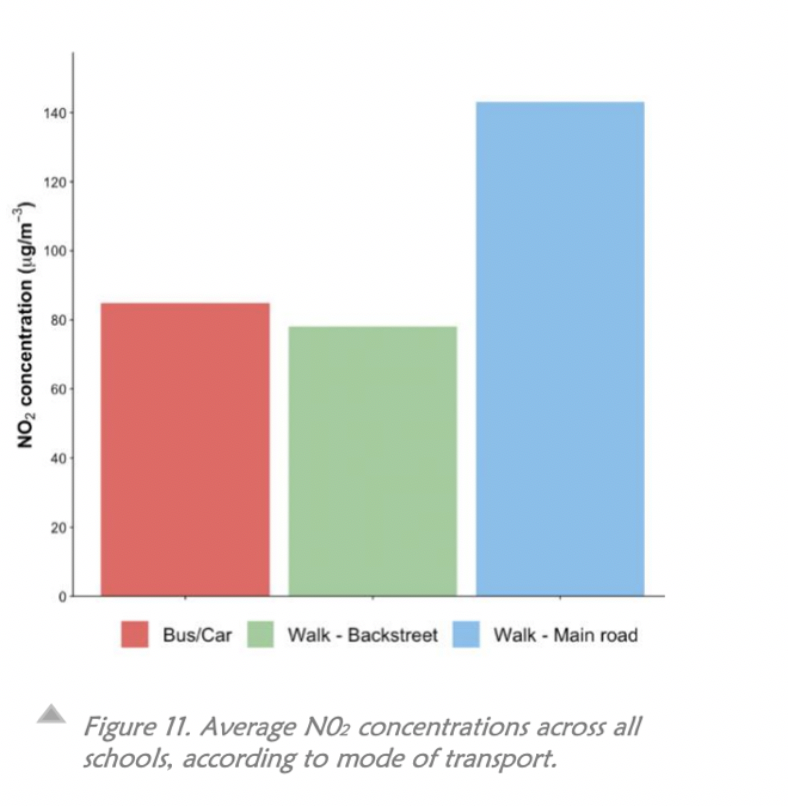
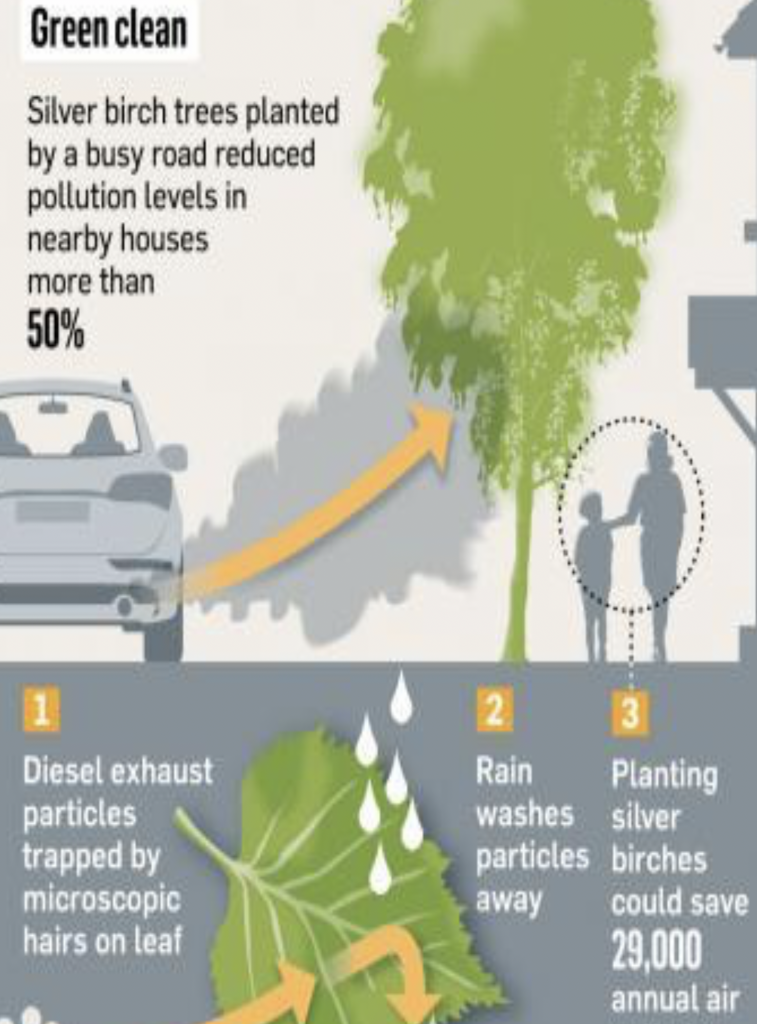
The results were very fascinating! We were initially very relieved to find out that the diffusion tube set up in the school site recorded the lowest reading. We were not so happy to find out that the actual reading was exactly on the WHO recommended maximum for nitrogen dioxide levels of 40μg/m3! Some of the results analysis from both our primary and secondary data, showed very high levels of both nitrogen dioxide and particulates, especially where the data had been collected closest to the busiest roads. The Sycamore leaf data did show that away from the busy roads the air quality was much better. We did capture some particulates in our particulate catchers, but the findings were inconclusive and we really need to carry out further tests. There was of course some uncertainty about the data from #UCLChemAirPoll, as with all investigations there may well have been some experimental error, and we look forward to finding out how our school’s data compares with that from other schools when it has been analysed. We definitely did discover that the air quality around London is way too high though, and varies greatly during a 24 our period. We also found out that there are many steps that we can take to reduce the risks associated with exposure to poor air quality. Our pupils determined that we are most at risk during our journeys to and from school and advise walking to school along the backstreets. We are also very keen to plant silver birch trees on the school site and will be presenting our findings and recommendations to Mrs Lunnon and Ms Boyd as soon as possible. We hope that some of our recommendations will be taken on board as part of our current building project. We are also very excited that we have been asked to write an article about our findings for the ASE Primary Science magazine. Watch this space!