

Our school smart meter energy-saving experiment
Ms Sinclair reports on the efforts of the Energy and Utilities team to reduce the school’s energy use, with the help of a smart meter
Which energy saving activity would save the most energy?
- Switching the lights off when not needed
- Lowering your central heating thermostat from 20˚C to 18˚C
- Only filling the kettle to the required level
Energy use is so ubiquitous that it can sometimes be difficult to know where to start when trying to reduce it. Do you really need to spend £1000s replacing some old appliance or is there low-hanging fruit for the picking, where immediate implementation can bring big rewards?
These are the kinds of questions that Sophia, Daisy and I have been wrestling with over the last 18 months, and with the complexity of the school site, it has sometimes felt impossible to know what we could usefully do.
Luckily for us, in January 2020 Wimbledon High School joined Energy Sparks, a web-based system that helps schools understand their energy use. Whilst similar systems exist in industry, Energy Sparks has the added benefit of making its analysis accessible to students as well as staff with helpful infographics and guidance like this:

Tools like Energy Sparks are only possible because the school has a network of smart meters around the site that take readings every half hour and report them to a central data system. Whilst Half-hourly/AMR meters have been required for high energy users for many years, it is only in the last 10 years that advantages of smart meters are being brought to people in their homes.
Whilst the totals and associated facts may be interesting, the real power of smart metering is the ability to look at your energy usage in granular detail. In this graph, for example, you can see the difference in electricity usage between two days last week.

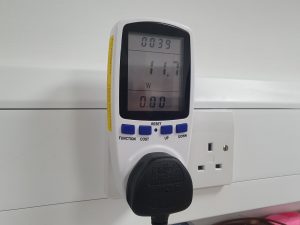
One of the top recommendations from Energy Sparks this year has been to reduce our baseload so that is in line with other schools. This is electricity that is always used on the site i.e. at weekends, during holidays, overnight and so on. Whilst the swimming pool may explain some of this difference, we were keen to see whether there was anything that we could usefully suggest to bring this energy use down. Armed with a handy plug-in energy meter, we toured the school measuring photocopiers, fridges, freezers, screens and any other appliance we could think of that might be left on overnight. Whilst measurements of an individual appliance might have seemed small, the numbers soon became more significant when the number of appliances was taken into account.
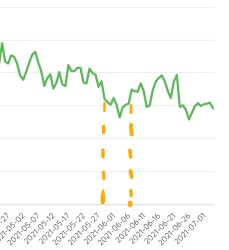
And so to our main experiment. Over the May half term, we worked with the IT, Estates and Catering teams to switch off unnecessary appliances and empty fridges, and to reduce heating where appropriate (we wouldn’t want the support staff to freeze!). Whilst the resulting dip might not seem very significant, we estimate that we achieved a 15% drop in our baseload over this week, not just saving energy, but also its related carbon emissions. The next challenge is to find out how to do this easily on a regular basis.
And finally, back to my quiz. The correct order was:
- Lowering your central heating thermostat from 20˚C to 18˚C (saving 33 TWh)
- Switching the lights off when not needed (saving 2.1 TWh)
- Only filling the kettle to the required level (saving 1 TWh).
However, these numbers are estimates for the whole of the UK housing stock. The best way for you to work out the energy savings you could make in your own home is to get a smart meter for yourself! Got one already? Why not try your own investigation this summer?